The article below is still in revision state and is to be published in due time.
Age related reference values of immunoglobulin A subclasses and the standardisation of the CRM 470 standard for IgA1 and IgA2
.
E.J.Nieuwenhuys, S.J.Janssen, A.J.Hannema, T.A.Out.
Central Laboratory of the Netherlands Red Cross Blood transfusion service, Department of autoimmune diseases /Immunochemistry, Plesmanlaan 125, 1066 CX, Amsterdam, The Netherlands.
Keywords: IgA1, IgA2, reference values, IFCC, CRM470
Summary
The concentration of the two immunoglobulin A (IgA) subclasses varies widely with age. There are no standards available in which the concentrations of the IgA subclasses is given in g/l together with age related reference ranges. We therefor standardised the IFCC/BCR/CAP CRM470 standard for IgA1 and IgA2 and calculated normal reference ranges that can be used in conjunction with this standard.
Two assay methods were used for the quantitative determination of IgA1 and IgA2, a RIA and an automated EIA.
We found that is was possible to use sera of healthy children combined with sera of patients who were suspected for allergic or rheumatic disorders to calculated age related reference ranges for the IgA subclasses.
The concentration of IgA, IgA1 and IgA2 was measured in the serum of 505 individuals younger than 17 years and 65 blood donors.
The reference values for the different age groups were calculated by a percentile method.
Introduction
On weight basis depending of the age we found in this study that 84%-89% of the IgA in serum is IgA1, the rest is of the IgA2 subclass. In secretions 30 - 45% of the total IgA is IgA2 (Cunningham). Two allotypes of IgA2 are known. A2m(1) and A2m(2).
Most IgA is found in secretions were two IgA antibodies are linked by a glycoprotein, the secretory piece. In serum most of the IgA is monomeric (80% to 90%).
There are no hard associations with diseases and a decreased or increased concentrations of one of the IgA subclasses in serum. There is an association that the prognosis of an IgA2 Kahler is worse than that of an IgA1. (SAS)
An total absence of one of the subclasses may be important in relation to the formation of antibodies to the deficient subclass (Osawa).
According to Mestecky (..) IgA may play a role as an anti inflammatory antibody in serum while it does not (easily) activate the classical pathway of complement system. It inhibits in this way the reactions mediated by the other isotypes.
Selection of 1608 measurements of IgA1 en IgA2 from our database showed that 20% was decreased for IgA1 and 18% for IgA2 in relation to the presented normal ranges. Almost all IgA subclass measurements are done together with measurements of the IgG subclasses. In most cases the indication for the measurements is a recurrent infection.
The concentration of the two IgA subclasses varies widely with age. No study is found after 1984 of age related reference ranges for the IgA subclasses in serum. The reason is probably the difficulty in obtaining enough sera of normal young individuals. This study presents an alternative approach to obtain normal reference ranges for the IgA subclasses in relation with the easily obtainable IFCC/BCR/CAP CRM 470 standard.
We used sera from patients that were negative in the RAST for different allergens, sera that were negative in the IgM rheuma factor test and sera of healthy normal young children. We assumed that if we calculated the normal reference ranges for total IgA for the different age groups and they were equal to the reported ones for total IgA, we could use these sera for the calculation of the normal reference ranges for the IgA subclasses.
Materials and methods
Sera.
Sera of 338 patients that were sent in for routine screening IgE anti -pollen, -house dust mite, -cat, -dog, -guinea pig, -rabbit, -aspergillus and -alternaria antibodies and were negative for these allergens were collected. The sera were stored at 4/C for a maximum of four weeks and kept frozen at 20/C.
Ninety-five IgM rheuma factor negative individuals that were sent in for this test were collected. The IgM rheuma factor negative sera were frozen at -20/C within two days after collection.
Above mentioned sera were sampled in a period of 18 months.
Sera of 72 healthy children below the age of 4 years were used to complete the group. The sera were stored at -20 /C for four years before use.
Sera of 65 adult healthy blood donors were collected, stored at 4/C and measured within one week after collection. The male/female ratio was nearly equal in the selected sera.
Standards and reference preparations
The following preparations were used:
WHO freeze dried reference preparation IRP lot number. 67/86, IgA level 100 IE/ml, corresponding to 1.64 g/l (.... )
H004-N2-3 -20EC frozen (Central Laboratory of the Blood transfusion service (CLB), Amsterdam, The Netherlands) contains according to the leaflet 2.12 g/l IgA.
The 1562, an local standard serum, made of a pool of 1500 blood donors and stored in liquid nitrogen, contains 2.05 g/l IgA.
1563, a local control serum, acquired and stored as the 1562 standard, IgA concentration 1.60 g/l.
The Binding Site freeze dried standard (Birmingham, United Kingdom) catalogue number BP062, batch number R2763 contains according to the leaflet 1.20 g/l IgA1, 0.371 g/l IgA2 and 1.472 g/l IgA.
Assays
Total IgA
The concentration of total IgA was measured with the Behring Nephelometer (Behring Werke AG, Marburg, Germany), according to the procedure supplied with the batch of sheep anti human IgA antiserum, SH14N (CLB, Amsterdam, The Netherlands).
The standard used was the H004-N2-3 (Central Laboratory of the Blood transfusion service (CLB), Amsterdam, The Netherlands).
The results of the measurements were used if the control serum was within 10% of its target value.
The CV of the control serum was 6% (n = 20).
IgA1 and IgA2
Radio immuno assay
Specific anti IgA1 and anti IgA2 were purified from chimpanzee anti IgA subclass antisera (......) with the use of sepharose bound IgA myeloma preparations.
[125I] anti-IgA1 was prepared by ionidation of 50 :g specific isolated chimpanzee anti-human-IgA1 or -IgA2 with 37 Mbq 125I and filtration through an ACA44 column (Pharmacia, Upsala, Sweden)( van Loghem ...).
50 :l of a pool of normal sera were coupled to 100 mg CNBr activated sepharose 4B (Pharmacia, Upsala, Sweden). This was dispensed in 100 ml Phosphate Buffered Saline (PBS), containing in addition 0.02% Tween80, 0.05 M EDTA , 0.05% NaN3.
500 :l of this suspension was incubated with 50 :l of different serum dilutions and about 5 ng [125I], i.e. 1 kBq, labeled antibodies.
After two days incubation the sepharose was washed and the bound antibodies were counted on a LKB gamma scintillation counter (LKB, Upsala, Sweden).
The results, obtained in 20 different sessions, were approved for if the control serum was measured within 20% of its reference concentration.
The 1562 standard was used as calibrator.
The inter CV (n=9) of the RIA was 9% for IgA1 and 17% for IgA2. The assays were specific at dilutions of 1:10 or more.
At a 1:10 dilution the detection limit was for IgA1 2.5 mg/l and 0.8 mg/l for IgA2.
The inter assay CV for the IgA1 RIA was 10% and for the IgA2 RIA 14%.
EIA
On a Enzymun System ES300 (Boehringer, Mannheim, Germany) were monoclonal anti-human-IgA1 MH141 (CLB, Amsterdam, The Netherlands) and monoclonal anti-human-IgA2 NI512 (Nordic, Tilburg, The Netherlands ) were used as biotynilated capture antibody (7 biotines per antibody). Monoclonal Horse Radish Peroxidase labeled anti-human-IgA MH14 (CLB, Amsterdam, The Netherlands) was used as detecting antibody. All the other reagents are provided by the supplier of the ES300.
For IgA1 50 :l of serum dilution is incubated with 450 :l PBS/BSA 0.3% containing 0.5 :g of biotynilated anti-IgA1. After 1 hour incubation the tubes are washed and 500 :l 1:6000 in PBS/BSA 0.3% diluted anti-IgA, HRP labeled, is added. After one hour incubation the tubes are washed and the ABTS conjugate is added. The color is measured after 30 minutes.
For IgA2 500 :l PBS/BSA 0.3% containing 0.5 :g of biotynilated anti-IgA2 is incubated in the tubes for 1 hour. After washing an incubation with 50 :l of serum dilution and 450 :l PBS/BSA 0.3% takes place. After 1 hour the tubes are washed and 500 :l 1:1000 in PBS/BSA 0.3% diluted anti-IgA HRP labeled is added. After one hour incubation the tubes are washed and the ABTS conjugate is added. The color is measured after 30 minutes.
The 1562 standard was used as calibrator.
The results were valid if the measured control serum was within 10% of its reference range. The inter assay CV (n=13) was 9% for IgA1 and 8% for IgA2 and the intra assay CV (n=15) of both tests was 6%.
The detection limit of an undiluted sample is 0.03 mg/l for IgA1 and 0.10 mg/l for IgA2.
The cross reactivity for these assays were tested with purified paraproteins. In the IgA1 assay no signal was found for concentration up to 10 g/l. In the IgA2 assay 0.03 g/l was measured in 10 g/l of a purified IgA1 paraprotein. Undiluted IgA deficient sera (< 0.3 mg/l) gives no signal in both assays.
Regression statistics between the RIA (x) and the EIA (y) assay were for IgA1: R=0.954 (R0.95= 0.937 - 0.966), slope 1.05 (a0.95=1.04-1.06) intercept=0.5 (b0.95=0.0- 1.0) mg/l, n=156. For IgA2 it was: R=0.973 (R0.95= 0.955 - 0.984), slope 0.94 (a0.95=0.92- 0.95) intercept=-0.53 (b0.95=-1.1- 0.0) mg/l, n= 62.
Standardisation
Standardisation of 1562
In the RIA the standards H004-N2-3 (nephelometer standard), 1562 (RIA and EIA standard) and control serum 1563 were standardised in g/l for the concentration of IgA1 and IgA2 against a standard serum of The Binding Site.
The standardisation was performed in triple with six serial 1:2 dilutions in three different sessions.
The test was approved for if our control was measured within 10% of its target value.
Standardisation of CRM 470
The IgA subclasses were measured in the same standards and control as above in the ES300 system together with the IFCC/BCR/CAP - CRM 470 standard, lot number 91/0619 No 2205 (Community bureau of reference, Rue de la Lot 200, B-1049 Brussels, Belgium).
Five serial 1:2 dilution were made in triplicate. The tests were performed in three different sessions.
The test was approved for if our control was measured within 10% of its target value.
Nephelometer
Total IgA was measured with the Behring nephelometer. Two serial 1:2 dilutions were made by the nephelometer of H004-N2-3, 1562 and CRM 470 standards and our control serum 1563. The CRM 470 standard was used as calibration line.
Statistics and calculations
A self written logit regression program was used for the calculation of the concentrations from the raw data from the RIA, EIA and nephelometer.
A self written program for weighted linear regression ( .....) was used for the comparison study of the regression analysis.
Calculations of the reference ranges were done with the LOTUS 123 package.
The 95% percentile calculations were done according to Rumke(...). For this study the 2.5 en 97.5 percentile with a reliability ( of 95% was used.
Results
Standardisation
In the RIA method the 1562 serum standard was calibrated against the Binding Site standard BP062 for IgA1 and IgA2 in g/l. Because of differences in total IgA measured in the BP062 standard (1.26 +/- 0.02 g/l) in the nephelometer technique and the sum of the subclasses given (1.57 g/l) we corrected the found concentrations of IgA1 and IgA2 by 1.57/1.26. The BP062 standard was thus only used to determine the proportion of IgA1 and IgA2. It was assumed that due to the large size of both pools this proportion would not be very different.
The calculated concentrations in the 1562 standard were 1.63 g/l IgA1 ("5%) and 0.57 g/l IgA2 ("9%).
To check if it was valid to make the above mentioned assumption we plotted the sum of IgA1 and IgA2 against total IgA from 58 samples with a IgA2 concentration larger than 30% of total IgA measured routinely with the EIA method. The following results were found with weighted linear regression: Total IgA = 0.94 * (IgA1+IgA2) + 0.03 g/l, Spearman R=0.98. If the samples above 2 g/l are discarded the slope becomes 1.06 with an intercept of -0.07. As can be seen no large error in the IgA2 concentration can be expected.
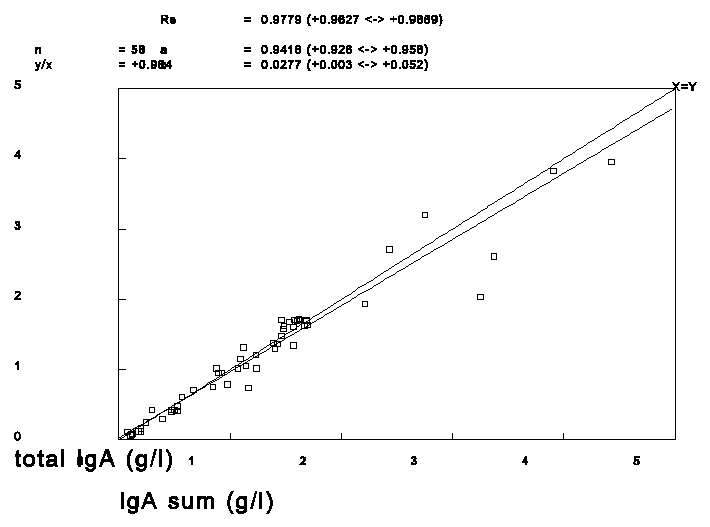
Figure 1. The sum of the IgA subclasses of sera with a content of more than 30% IgA2 of total IgA versus the measured total IgA concentration.
IgA levels in different standards
To check if the concentrations of IgA, and thus IgA1 and IgA2, we had assigned to the 1562 standard in relation to the WHO IRP standard was equal to the new IgA concentration assigned by the IFCC/BCR/CAP to the CRM 470 standard the H004-N2-3, 1562 and 1563 CLB serum pools were standardised in the nephelometer against the CRM 470 standard.
As a control the CRM 470 standard was also measured as sample to check the measurement and the calculations. The results are shown in table 1.
|
Serum pool |
IgA (g/l) provided |
IgA (g/l) measured |
recovery |
|
H004-N2-3 |
2.12 |
2.01 |
95 % |
|
1562 |
2.05 |
1.97 |
96 % |
|
1563 |
1.60 |
1.51 |
94 % |
|
CRM 470 |
1.96 |
2.02 |
103 % |
Table 1. Total IgA levels in different serum pools as provided and measured after
standardisation on the CRM 470 standard.
Because there was a small difference we concluded that the IgA, IgA1 and IgA2 concentrations were interchangeable between the WHO and IFCC/BCR/CAP standard.
IgA subclasses in different serum pools
In the ES300 system the CRM 470 standard was standardised against the 1562 calibrator. Six serial 1:2 dilutions were tested in threefold in three different sessions. One IgA1 session was discarded because the control deviated more than 10%.
The CRM 470 standard contains 1.50 g/l IgA1 VC=6.1%, n=36 and 0.36 g/l IgA2 VC=11.7% n=53. In table 2 the results are shown for the calibrated serum pools in g/l standardised on the standard 1562.
|
Standard |
total IgA
(WHO) |
total IgA
(CRM470) |
IgA1 |
IgA2 |
IgA1 + IgA2 |
|
H004-N2-3 |
2.12 |
2.01 |
1.36 |
0.35 |
1.71 (85%) |
|
1563 |
1.60 |
1.51 |
1.22 |
0.37 |
1.59 (95%) |
|
CRM 470 |
|
1.96 |
1.50 |
0.36 |
1.86 (95%) |
Table 2. IgA1 and IgA2 concentration in different serum pools after standardisation on the 1562 standard compared with the total IgA concentration standardised against the WHO and CRM 470 standard all in g/l.
To test if the standardised concentration of IgA1 and IgA2 were correct in relation to the total IgA concentration we extracted one year of results performed with the RIA and six months of results acquired with the EIA from our database. The results are presented in figure 2 and 3.

Figure 2. Weighted linear regression of total IgA against the sum of IgA1 and IgA2 performed in the RIA. n=674, slope = 1.0357, intercept = -0.0551 g/l, Pearson R = 0.9365.
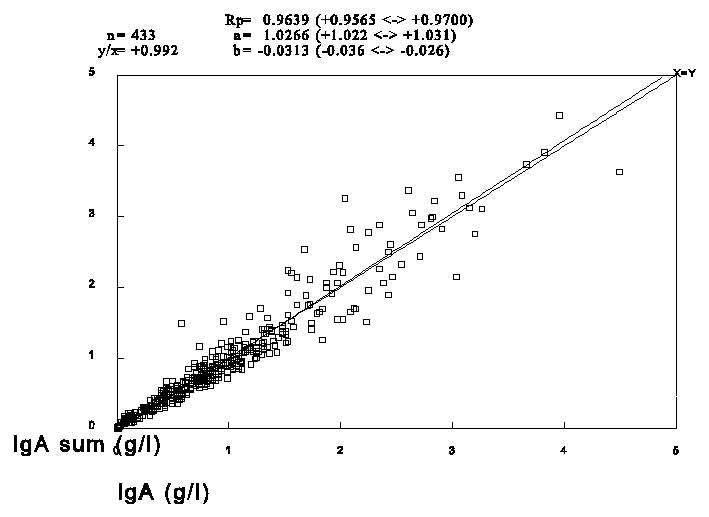
Figure 3. Weighted linear regression of total IgA against the sum of IgA1 and IgA2 performed in the EIA. n=433, slope = 1.0266, intercept = -0.0313 g/l, Pearson R = 0.9762.
Measurements for the establishment of the normal reference values
In the selected sera of the children IgA1 and IgA2 was measured in the RIA with the 1562 as standard and total IgA was measured on the nephelometer with the H004-N2-3 as standard. The results are shown in figures 4, 5 and 6.
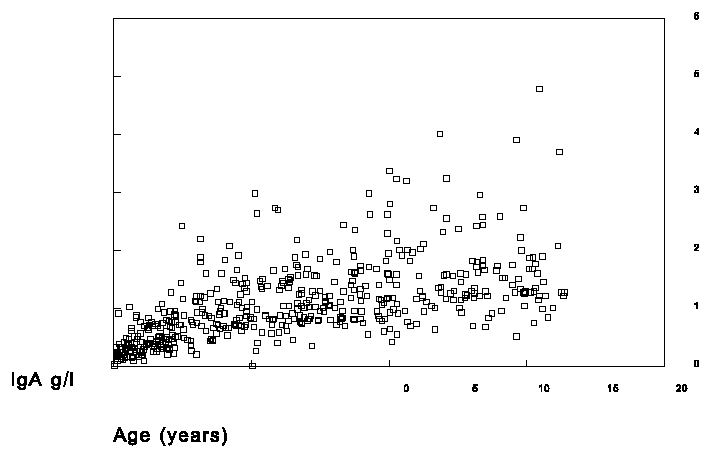 Figure 4. Measurement of total IgA in sera of children.
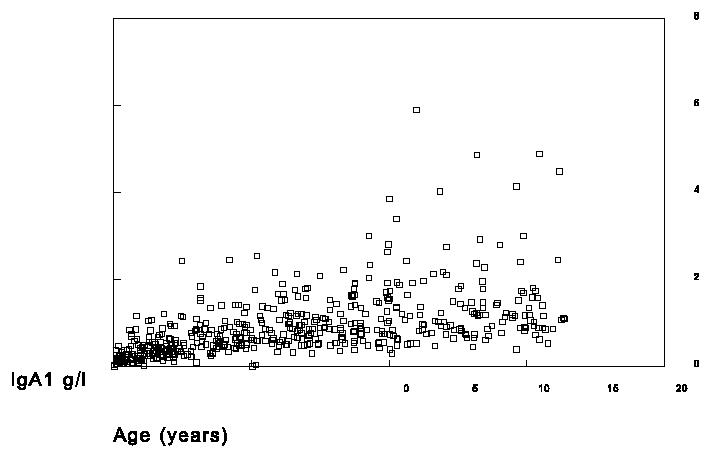 Figure 5. Measurement of total IgA1 in sera of children.
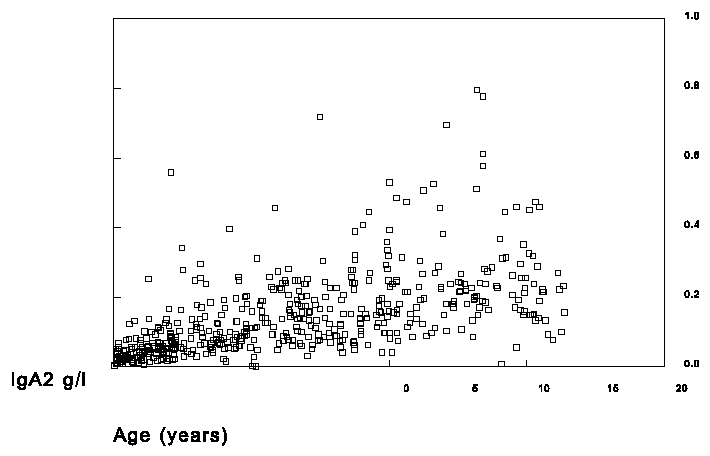 Figure 6. Measurement of total IgA2 in sera of children.
To make the study complete the concentration of IgA1 and IgA2 was measured in the EIA and total IgA on the nephelometer in the serum of blood bank donors (data not shown).
The results were sorted per age group and the concentration found at the position, as given by the study of Rhmke, was taken as the lower or the upper limit of the reference value of that age group. The position that was taken is given in table 3 in the row denoted by Ai@.
In figure 4 the concordance between the normal reference values as calculated from the group used in this study and those used by the CLB and Behring is shown. Figure 5 shows the concordance of the calculated reference range of IgA and those of the sum of the IgA subclasses.
Table 3 shows the upper and lower limits of the different age groups of the calculated normal values of IgA, IgA1 and IgA2.
|
Age (years) |
<1 |
1-2 |
2-4 |
4-6 |
6-9 |
9-12 |
12-17 |
>17 |
|
n |
57 |
55 |
74 |
65 |
106 |
71 |
87 |
65 |
|
i |
5 |
4 |
5 |
5 |
7 |
5 |
6 |
5 |
|
IgA lower |
0.10 |
0.21 |
0.46 |
0.54 |
0.72 |
0.64 |
0.85 |
1.06 |
|
IgA upper |
0.52 |
0.85 |
1.61 |
2.08 |
1.90 |
2.98 |
2.74 |
3.62 |
|
IgA1 lower |
0.074 |
0.13 |
0.34 |
0.42 |
0.49 |
0.49 |
0.65 |
0.61 |
|
IgA1 upper |
0.59 |
0.88 |
1.41 |
1.67 |
2.03 |
3.00 |
2.93 |
2.38 |
|
IgA2 lower |
0.011 |
0.016 |
0.052 |
0.048 |
0.059 |
0.081 |
0.10 |
0.13 |
|
IgA2 upper |
0.056 |
0.12 |
0.28 |
0.26 |
0.28 |
0.47 |
0.51 |
0.60 |
Table 3. Normal reference values of IgA1 and IgA2 in g/l. In the table n is the number of tested individuals, I the position of the concentration that should be taken from the sorted array of concentrations for the lower and upper reference value counted from the first or the last.
The average of the median and the two adjacent concentrations, so 5 concentrations, were calculated. As can be seen from table 4 the proportion IgA1 slowly decreases from 89% to 84%. If the median and the 5 adjacent concentrations were calculated no difference in the calculated percentages were found.
|
Age (years) |
<1 |
1-2 |
2-4 |
4-6 |
6-9 |
9-12 |
12-17 |
>17 |
|
IgA1 |
0.21 |
0.20 |
0.46 |
0.55 |
1.20 |
0.80 |
1.39 |
1.00 |
|
IgA2 |
0.027 |
0.026 |
0.058 |
0.084 |
0.19 |
0.11 |
0.24 |
0.19 |
|
%IgA1 |
89 |
88 |
89 |
87 |
86 |
88 |
85 |
84 |
Table 4 Average of the median and the two adjacent concentrations of IgA1 and IgA2 in g/l and the percentage IgA1 of the sum of the subclasses in relation with age.
Discussion
We used the Binding site BP062 standard to standardise our 1562 standard for IgA1 and IgA2 in a RIA method. After correction for the difference of total IgA in both standards we checked if the assigned concentrations for IgA1 and IgA2 were valid by various methods. After we were confirmed that the concentrations were applicable we standardised the CRM 470 standard in a new developed EIA that gave greater precision and was automated.
Although the method of calculating reference ranges from sera of patients is discussible we investigated if it was possible to use sera from patients that were tested for suspected allergic or rheumatic disorders. A selection was made of sera that were negative in the RAST or negative in the IgM rheuma factor EIA test and the group was completed with sera of healthy children. After the concentrations were plotted against age no difference was seen between the three selected groups.
We proposed that if the calculated reference ranges for IgA were about the same in shape and concentration as the accepted reference ranges, it was reasonable to suggest that the IgA1 and IgA2 concentrations in those sera could also be considered normal.
The approach chosen for in this study is probably only applicable for the IgA subclasses because the sum of the two subclasses must equal that of total IgA.
The normal reference ranges for adults were established in blood donors to complete this study.
After the measurement of IgA1, IgA2 and total IgA in the group of children we checked if the normal reference values calculated for total IgA matched with accepted ones. We choose our own reference values and those provided by Behring.
The comparison of the normal reference ranges for IgA (figure 7) match surprisingly well taking in account the old study of Stiehm and Fudenberg, who used purified proteins as standard for their measurements in radial immune diffusion technique, 30 years ago. Also the comparison with the Behring reference ranges fits good.
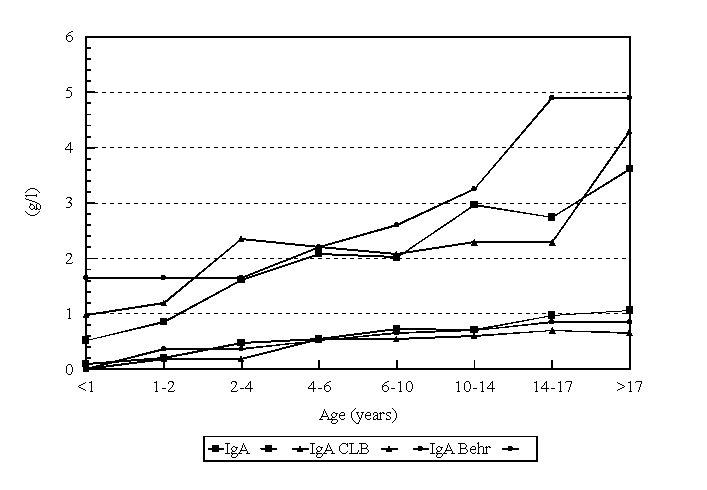
Figure 7. Comparison of the calculated reference values with the normal values as used by the CLB and Behring Werke.
The greatest account for the differences in the sum of the IgA subclasses and total IgA will be the still small group of tested sera. As can been seen from table 1, Ai@, the concentration to be picked from the ranked concentrations, is small. If the sorted concentration taken from one rank higher or lower, the difference between the used one has an average deviation of respectively 13%, 14%, 13%, 14% (range 0 - 43%) for the lower and upper reference value of IgA1 and IgA2 for the different age groups.
The sum of the calculated reference values should be equal to those of total IgA if the standardisations were performed well. As can be seen in figure 8 these data match.
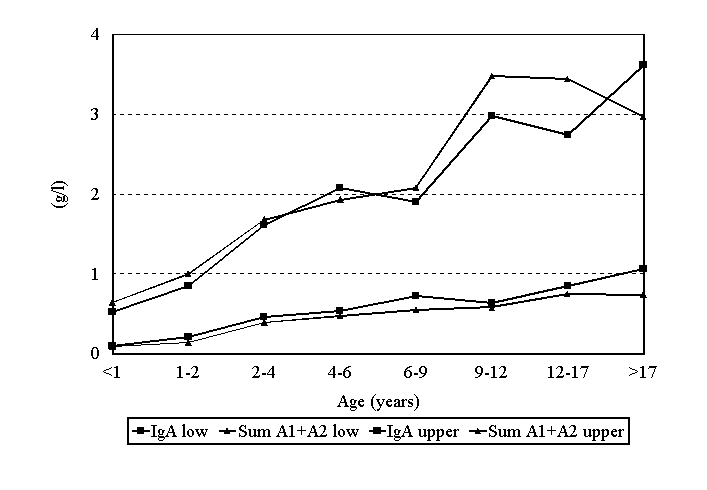
Figure 8. Sum of the IgA subclass reference values compared with the measured total IgA concentration.
Another check if the standardisation was adequate we calculated the weighted linear regression between total IgA of the same samples measured with the nephelometer and the sum if the IgA subclasses measured routinely in 1993 with the RIA and six month of routinely measured samples with the EIA. The calculated slopes and intercepts show that the use of different techniques gave no great deviations (figure 4 and 5) in the slope and the intercept. As can be seen the use of an automated EIA system instead of a RIA improved the reproducibility significantly.
Because the IgA1 concentration determines for the greater part the correlation with total IgA and a poor standardisation of the IgA2 concentration would not be recognised in the calculations shown in figure 4 and 5. We extracted 57 samples measured with the EIA with a IgA2 concentration greater than 30% of total IgA. If the error in the calculated IgA2 concentration in the standard was large the slope between total IgA and the sum of the subclasses should deviate from 1.0. As can be seen the slope was 0.95 and an intercept of 0.03 g/l. If the concentrations of total IgA above 2 g/l are discarded (n=51) the slope becomes 1.06 with an intercept of -0.07 g/l and a correlation of 0.97.
The proportion of IgA1 in relation to the sum of the subclasses was calculated from the average of the median and its two adjacent concentrations. The lowering proportion of IgA1 with age was striking. This is not what was to be expected from the study of Ventura ( ) were two groups of blood donors with median ages of 32 and 68 years were examined. He found an increasing proportion for IgA1 in elderly people. The study of Ventura suggests that the normal reference values for adults may not be pooled as done in this study.
In order to use the presented reference values an easily obtainable standard should be available. We therefor standardised the CRM 470 standard for IgA1 and IgA2 in g/l. This standard is available for standardisation of a secondary standard. We found that our own standards, that are WHO related, are interchangeable with CRM 470 related standards. This should be the same for other WHO related secondary standards. Behring standards are corrected down by 17% for total IgA to be CRM 470 related. The CLB standards should be corrected for about 5% (See table 1).
Because the correction to be made is small in relation to the significance of the calculated ranges, we think that these reference values can be used for both CRM 470 and WHO related standards.
This study shows that deep frozen standards (below -70 EC) should be used.
As can be seen in table 1 the sum of the subclasses is not the same as total IgA in the H004-N2-3 standard. We also noted this problem with another standard (data not shown) that was stored for several years at -20EC. Probably aggregation of IgA in the serum pool give rise to false results in the techniques used.
Alteration of standards and controls in time always presents a problem even in freeze dried products. The time in which this occurs is probably in direct relation with its rest water content.
The presented reference values may be helpful in studying the relation of IgA subclass increased or decreases concentrations in diseases. One should take in account that these normal reference values a calculated from sera of individuals from the Dutch population and is for the greater part Caucasian.
Acknowledgments
Without the help of Y. Barth, D. van Dyke, W. Kolhof, A. Lodder G. van Mierlo and F. van Oost hardly none of the more than 4000 measurements used in this article would have been performed.
References.
1. Nieuwenhuys E.J., Out T.A. Normal values of IgG subclasses. Protides of the biological fluids 1989;71-79.
2. Rumke, C.L., Bezemer P.D. (1972), Methoden voor de bepaling van normale waarden II. Nieuwe methoden, Ned. T. Geneeskunde 1972;116,35:1224-1230.
3. Simmons P.D., Plasma proteins diagnostics, Behring diagnostica,1st edition, 24.
4. Stiehm E.R., Fudenberg H.H. Serum levels of immune globulins in health and disease: a survey, Pediatrics, 1966;vol 37,5,part I:715-727.
5. Lochem van E., Zegers B.J.M., Bast E.J.E.G.,Kater L. Selective deficiency of immunoglobulin A2, J. Clin. Invest. 1983;volume 72:1918-1923.
6. Haayman J.J., Radl J. Monoclonal antibodies against isotypic and isoallotypic determinants of human IgA1 and IgA2: fine specificities and binding properties, Molecular Immunology, 1987;24, no 11:1223-1224.
7. Haun M., Wasi S. Biotynilated antibodies bound to streptavidine beads: a versatile solid matrix for immunoassays, Analytical biochemistry 1990;191:337-342.
8. Mestecky J. Immunologic considerations if IgA and IgA containing immune complexes, American journal of kidney diseases, 1988;12,no 5:378-383
9. Liblau R.S.,Bach J.F. Selective IgA deficiency and autoimmunity, Int Arch Allergy Immunol, 1992;99:16-27
10. Ventura M.T. Evaluation of IgA1-IgA2 levels in serum and saliva of young and elderly people. Allergol. et immunopathol. 1991;19,5:183-185


 Figure 4. Measurement of total IgA in sera of children.
 Figure 5. Measurement of total IgA1 in sera of children.
 Figure 6. Measurement of total IgA2 in sera of children.
