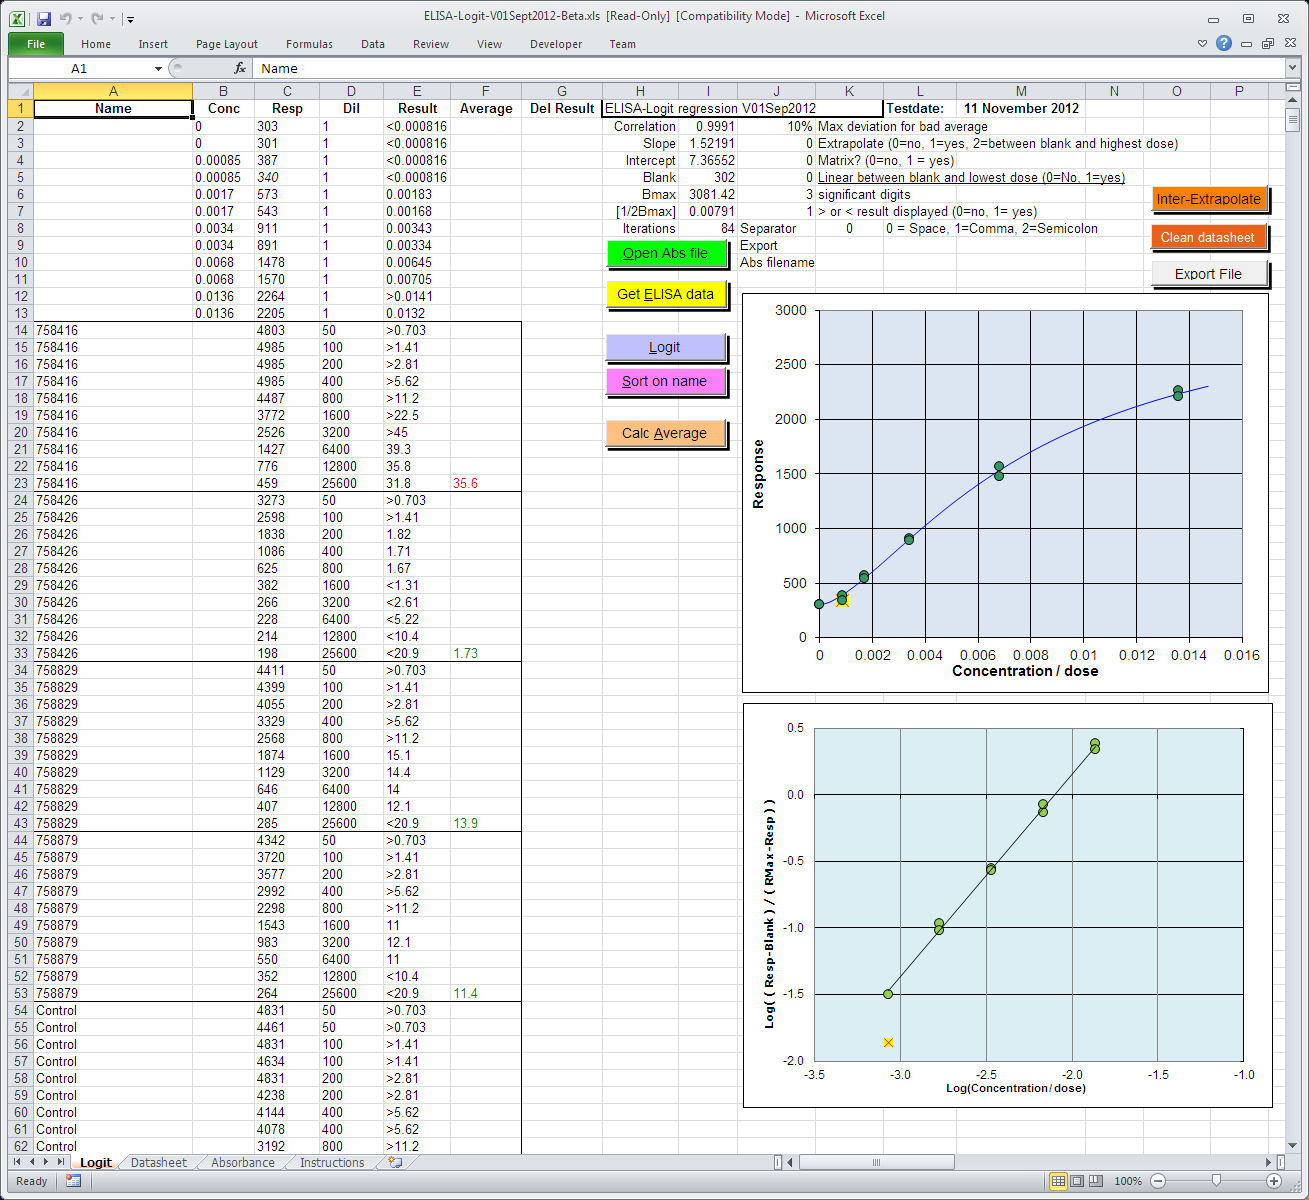
This logit regression program in Excel is
optimised to work with ELISA-data.
The program can be used for fitting all sigmoid and half-sigmoid curves until
a straight line.
Read the instructions carefully on the sheet "Instructions" in the
XLS-worksheet.
The program let you choose:
- the number of significant digits in the result,
- it calculates an average of the results,
- it warns in red when a results deviates more then a give percentage from the
mean,
- and many more
Advise (rules of thumb):
Do not use more than 5 doses and one blank. (This logit needs a blank! (zero
dose)).
If you want to use more data points invest in multiplos instead of more doses.
The lowest point of the curves must be higher than 10 times the standard
deviations of the noise in your blank
The highest point of your curves should be 10% higher in response than the
second highest response.
Do not copy, move and paste in the worksheet. If the program does not work
properly use a new clean copy of it.
Five versions of the Logit program in an Excel-sheet are available.
| Version | |
| ELISA-logit21042005 | First validated program |
| ELISA-Logit-V04apr2007 | V21042005 --> V04apr2007 absorbance file input directly from two types of ELISA-readers. |
| ELISA-Logit-V25Oct2009 | V04apr2007 --> V25Oct2009 Corrected some type errors in text |
| ELISA-Logit-V01Sept2012-Beta | V25Oct2009 --> V18jun2011 Corrected some type errors
in text; added example files; added < or > result in average column |
| ELISA-Logit-V03Feb2013_1.xls | V03Feb2013_1 Latest final stable version |
| Handleiding_Logit_in_Excel.pdf | Manual in Dutch |
Enable macro's to run the program!
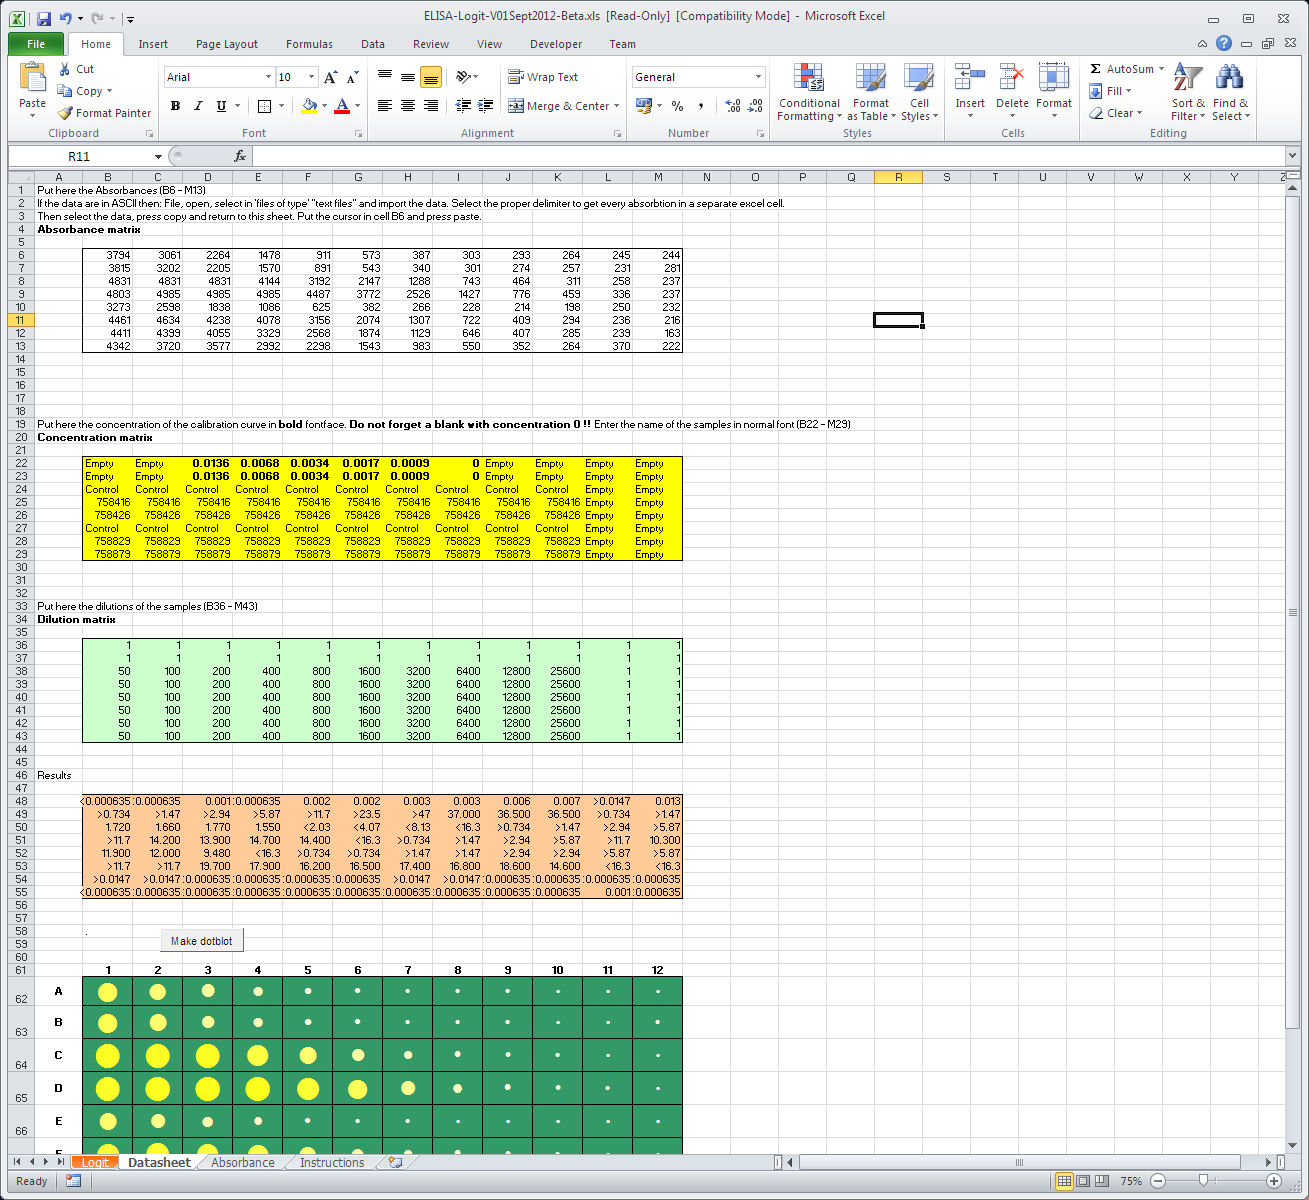
These programs can be used for non-profit purposes (Copyright 1998-2016)
This page was revised 26 November 2016 by Ed Nieuwenhuys