Three Microsoft Excel calibration programs for the laboratory
This
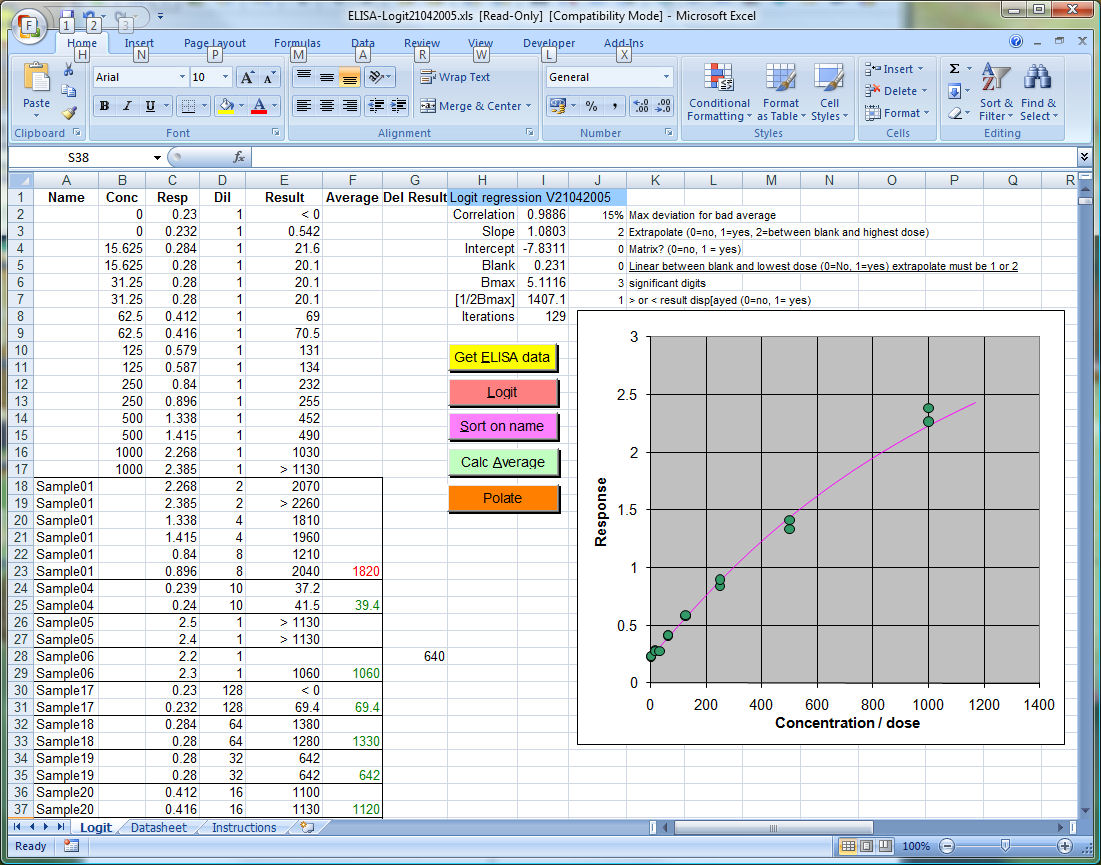
logit regression program in Excel is optimised to work with RIA and ELISA-data.
The program can be used for fitting all sigmoid and half-sigmoid curves and even
a straight line.
Logit,
4-parameter or Rodbard regression
The
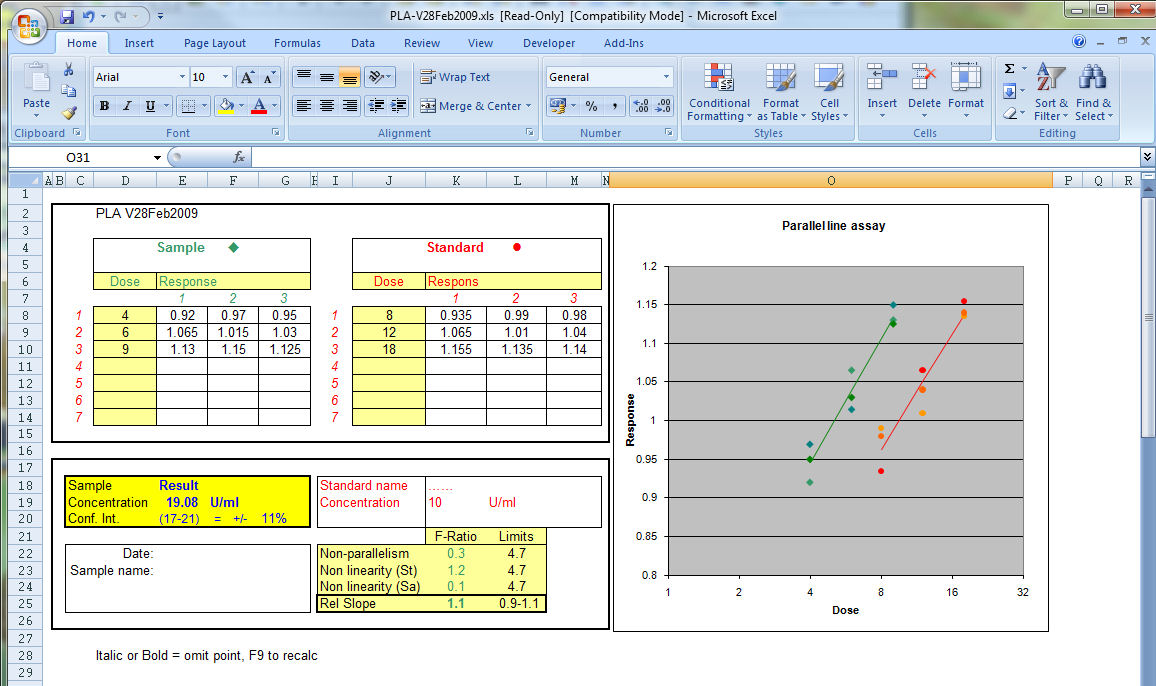
PLA presented here is written in Microsoft Excel and is an copy of the
method described by D.J. Finney.
Up to thirteen samples can be calculated by hand, from an ELISA plate reading or list of responses.
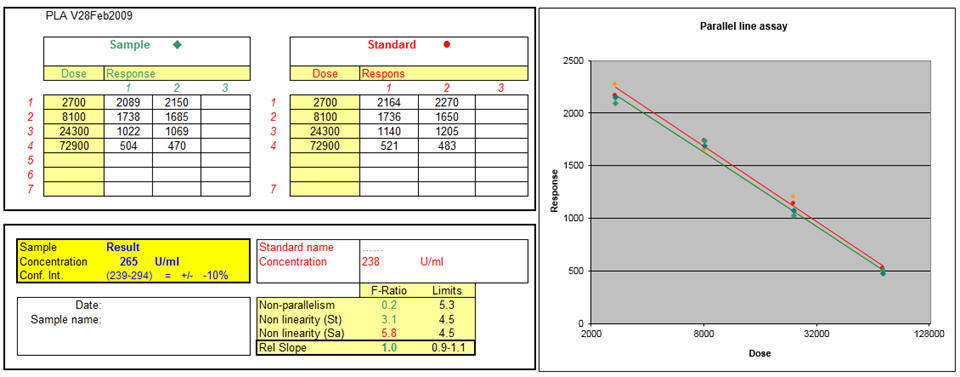
Parallel
line assay PLA
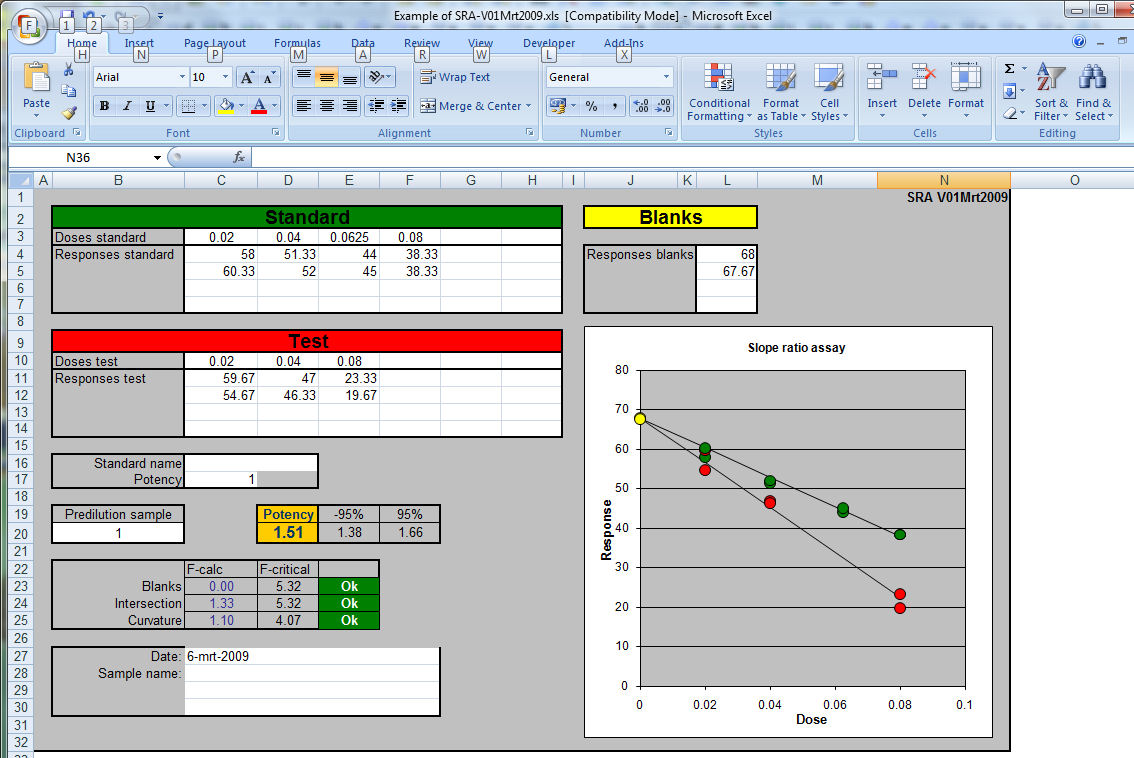
The
SRA presented here is written in Microsoft Excel and is an copy of the
method described by D.J. Finney.
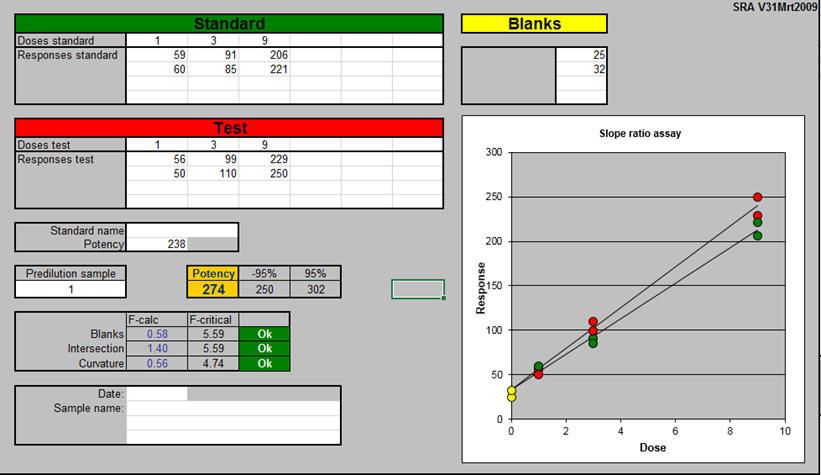
Slope ratio assay SRA
See below what is the 'best' calibration program to use.
| Logit | PLA | SRA |
 |
 |
 |
What calibration program is the best to use?
SRA, PLA or Logit?
In following example the data from an ELISA was fed
into the three methods.
The calibration line is entered in the logit
regression program.
The data pairs that were suitable to be entered in
the SRA are marked purple and the dose-responses that could be used in the
PLA are coloured red in the picture below.
For the SRA and PLA only those
parts that are linear after transformation can be used resulting is a
smaller measuring range that can be entered.
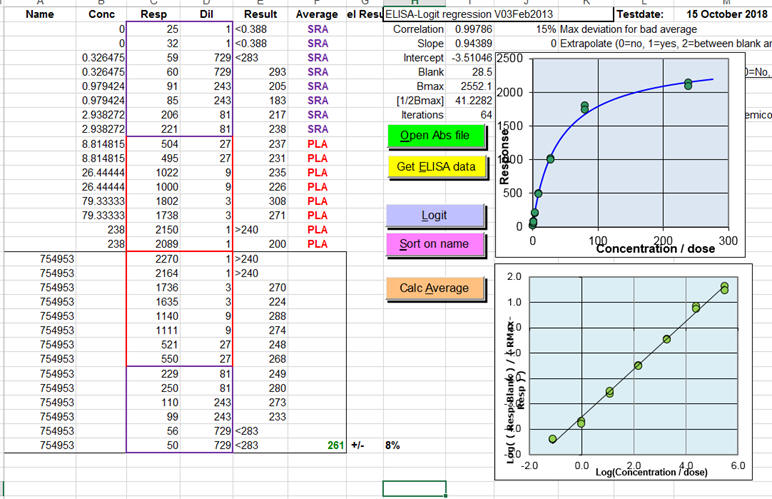
The results for the sample were calculated in:
PLA
as 265 ± 10%
SRA as 274 ± 10%
Logit as 261 ± 8%
My conclusions:
As to be expected the calculation method has no great
influence on the result.
All results fall well within in the
confidence limits of the three methods.
Benefits Logit
The measuring range is
large.
The rejection on SD of calculated result is based on historical
data.
Cons Logit
Does not test
directly whether sample dilutes parallel with the standard.
Because of
the long measuring range one should be careful with the
hook effect or prozone
effect.
NB both cons will be noted because the average will have a
bad standard deviation and be flagged)
Benefits PLA
Robust accepted calculation method with descriptive
statistics.
Disadvantages PLA
Relatively small measuring area.
The statistics is based on F-tests;
when a standard has perfect duplicates all sample results becomes invalid.
In practice this results is a rejection of a complete test so now and then
because the calibration line was so perfect by accident. And also the other
way round. Bad standard lines give valid results with large confidence
intervals.
SRA benefits
Suitable
for low concentrations and activity measurements.
Cons SRA
Often very small measuring
range because the dose is linear.
The statistics is based on F-tests and
not on historical performances of the test.
Final conclusion
My choice to use logit regression as first option is its simplicity and long
measuring range. It is simple in its rejection criteria and it is easier to
use in LIMS systems.
SRA and PLA are a better choice if linearity is an
issue.
HP41-C programs
I started learning programming
on a HP-9715 desktop calculator at my laboratory in the end of the 1970's.
When the HP41C handheld calculator arrived on the market the same programming
RPN-language was used and programming continued at home.
I made several programs and send them to the HP "Users' program library
Europe" so
they could be used by everyone.
Unfortunately this library is lost.
I retained a copy of most of my listings.
These have been
scanned and they are available for reference and their formulas.
If time comes I may add more. More in The museum of HP calculators
November 2009 - 2021
Ed Nieuwenhuys Email