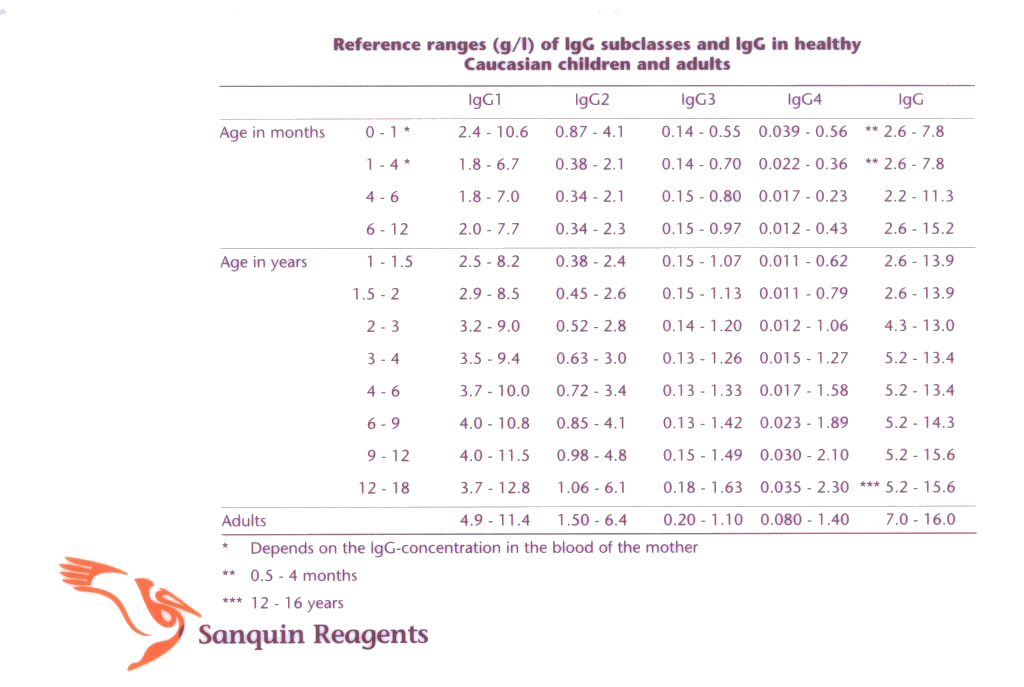
3 IgG subclasses in healthy children and adults.
3.1 Reference values of IgG subclass levels
Children52,56,59
The levels of total IgG and each of its four subclasses
follow a typical pattern during childhood (table III). The IgG present at birth
is mainly of maternal origin, because all IgG subclasses are capable of
placental transfer. In cord blood the concentration of IgG1 is 60% higher that
in maternal serum, indicating an active transport from mother to child. The
IgG2 serum concentration in the neonate is 10% lower than in maternal serum. The
concentrations of IgG3 and IgG4 are the same in cord blood and in maternal
serum.
After the first 6 months of life, during which IgG levels decrease, the
individual's own IgG production sets in, eventually reaching adult levels. Each
IgG subclass has an individual pattern of development, IgG1 and IgG3 attaining
adult levels at an earlier age than IgG2 and IgG4 (table III).
The serum levels of IgG1 and IgG3 reach about 50% of the adult serum levels at
the age of one year and about 75% at the age of five, all with large
inter-individual variations. The IgG2 and IgG4 subclass levels rise much
slower. Their serum levels reach about 20% of the adult levels at the age of
one year. At the age of five years about 50% of the adult levels is reached,
while at the age of fourteen it has been increased to 70%. Again, all with
large inter-individual variations.
Thus, when analyzing levels of IgG and its subclasses in pediatric patients,
values should be compared with reference values from the same age group.
Adults52,57,60
There are numerous publications on IgG subclass levels in different populations. The levels of IgG subclasses are not normally distributed. Therefore the normal (reference) ranges of the IgG subclasses should be chosen between the 2.5 and 97.5 percentile ranges (58). IgG subclass levels are associated with certain Gm allotypes: individuals homozygous for the G3m(b) allele have higher levels of IgG3 than homozygous G3m(g) individuals. Similarly, IgG2 subclass levels are slightly higher in individuals carrying the G2m(n) allotype compared to G2m(n)-negative individuals. The reference ranges of IgG subclass level in Caucasians are shown in table III59,60.
TABLE III: Reference ranges (g/l) of IgG subclasses
and IgG in healthy Caucasian children and adults:
|
|
IgG1 |
IgG2 |
IgG3 |
IgG4 |
IgG |
|
Age in months |
|
|
|
|
|
|
0-1 * |
2.4-10.6 |
0.87-4.1 |
0.14-0.55 |
0.039-0.56 |
** 2.6- 7.8 |
|
1-4 * |
1.8-6.7 |
0.38-2.1 |
0.14-0.70 |
0.022-0.36 |
** 2.6- 7.8 |
|
4-6 |
1.8-7.0 |
0.34-2.1 |
0.15-0.80 |
0.017-0.23 |
2.2-11.3 |
|
6-12 |
2.0-7.7 |
0.34-2.3 |
0.15-0.97 |
0.012-0.43 |
2.6-15.2 |
|
Age in years |
|
|
|
|
|
|
1-1.5 |
2.5-8.2 |
0.38-2.4 |
0.15-1.07 |
0.011-0.62 |
2.6-13.9 |
|
1.5-2 |
2.9-8.5 |
0.45-2.6 |
0.15-1.13 |
0.011-0.79 |
2.6-13.9 |
|
2-3 |
3.2-9.0 |
0.52-2.8 |
0.14-1.20 |
0.012-1.06 |
4.3-13.0 |
|
3-4 |
3.5-9.4 |
0.63-3.0 |
0.13-1.26 |
0.015-1.27 |
5.2-13.4 |
|
4-6 |
3.7-10.0 |
0.72-3.4 |
0.13-1.33 |
0.017-1.58 |
5.2-13.4 |
|
6-9 |
4.0-10.8 |
0.85-4.1 |
0.13-1.42 |
0.023-1.89 |
5.2-14.3 |
|
9-12 |
4.0-11.5 |
0.98-4.8 |
0.15-1.49 |
0.030-2.10 |
5.2-15.6 |
|
12-18 |
3.7-12.8 |
1.06-6.1 |
0.18-1.63 |
0.035-2.30 |
*** 5.2-15.6 |
|
Adults |
4.9-11.4 |
1.50-6.4 |
0.20-1.10 |
0.080-1.40 |
7.0-16.0 |
* Depends on the IgG-concentration
in the blood of the mother.
** 0.5 - 4 months.
*** 12 - 16 years.
